In previous articles, I have talked about all the valuable information you can obtain by using the USASpending.gov database. This free database houses substantial information about government spending of all types – contracts, grants, entitlements, and you can parse this data in any number of ways. I often use it to research my clients’ competitors to see how much and to whom they are selling.
The following video shows federal contract spending from 2000 through 2012, using the USASpending.gov web site. I wanted to show you one of the cool features of this site. The chart you see is a depiction of contract sales by recipients’ state since 2000.
The USASpending Animated Chart
Video Transcript:
The vertical axis depicts the approximate contract dollars.
The circles, or bubbles, represent each spending on contractors by their home state location. The bigger the bubble, the higher the percentage of contracts compared to the whole.
The horizontal axis depicts the number of contract actions that have been issued; that is, individual orders placed. Below the horizontal access is the timeline slider, which you can move to control what year you are looking at.
Now, let’s take a quick look at the growth of federal contract spending from 2000 to present. I will run this from beginning to end, and then I will go back and make some observations.
Pretty amazing.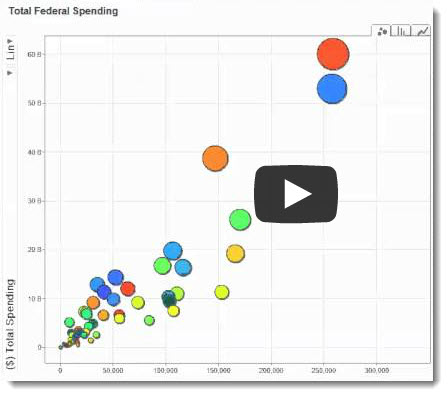
Now let’s take a closer look.
Let me show you this in slow motion:
As we start 2000, you can see that a few state that have numerous defense and federal contractors win a high percentage of the contracts. California, Virginia, Texas, followed by Maryland, District of Columbia and Florida.
Towards the end of 2001, or course 9/11 occurs and there is an increase in spending on homeland security and the outbreak of war in Iraq and Afghanistan. This accelerates rapidly through 2007.
In 2008 contract spending comes down a bit as the war in Iraq diminishes. Also, the great economic collapse occurs in the autumn of 2008.
In 2009, President Obama comes into office and the great recession rages on. While the stimulus bill sent hundreds of billions into the economy through grants to states and bailouts, the effect on federal contractor growth was not as significant as one might think.
Back to 2001 … George Bush becomes president and it’s interesting to see what happens to spending on firms from Texas, President Bush’s home state of course. Keep your eye on the orange bubble that represents Texas.
This may be due in part to cronyism, but of course even more so due to 9/11 and the outbreak of war. It is amazing at how much growth there is in Texas though.
Another interesting observation is that you see significantly more orders being placed to other states starting toward the end of 2003. As I drag the slider from 2003 and 2008, watch how many of the smaller states’ contractors start winning more contracts.
This corresponds perhaps to the positive effects of federal acquisition streamlining in the 1990s, which led to a great expansion of the GSA schedules program in the past 10 years, and other similar programs, such as the simplified acquisition procedure. Much of this likely benefits smaller businesses as you can the numbers of actions grows much more rapidly than the total dollar volume, which means many more smaller orders are being placed.
In 2010 and 2011 begins to see a shrinking in federal contracting dollars.
This is in part due to a democratic administration coming into power. Typically a republican administration tends to outsource more work than democratic administrations. But in this case, the larger reason is likely due to the budget wars in Washington DC, and the lack of budgets being passed by congress, which inhibits new program development.
In 2012 you can see federal contracting diminishing even more as the deficit and budget debates continue.
One final observation - - you may have noted that towards the end of 2012 and into 2013, federal contract spending seems to have diminished to pre-2000 levels. But that is not the case. This is more due to reporting requirements. You see, the defense department is not required to report spending as quickly as civilian agencies, simply to protect operational security, so if you check back in a few months, you will see the updated data.
There are many other reasons for why spending has grown or shrunk over the years, and you should dig deeper if you want to discern the reasons why. More importantly, I suggest you make greater use of this valuable tool for your own market and competitor research.